Algorithmic Trading For Individual Investors
This article introduces algorithmic trading for individual investors—what it is, how it works, whether it can be profitable, and how it differs from institutional algorithmic trading.
Please Note: Trading financial instruments is risky—please read our risk disclaimer
Contents
- What is algorithmic trading?
- Algorithmic vs discretionary trading
- How does algorithmic trading work?
- Institutional vs retail (individual investor) algorithmic trading
- Is algorithmic trading profitable?
- A blueprint for successful algorithmic trading
- TBC
What is algorithmic trading?
Algorithmic trading refers to automated (computer-driven) trading that can run autonomously. Algorithmic trading uses well-defined rules, often expressed as mathematical equations, to trade markets in pursuit of profits.
Algorithmic trading differs from discretionary trading, in which a trader can make trading decisions that may or may not be based on well-defined rules.
Discretionary traders may enter and exit trades based on market data, chart patterns, media reports, or other information which they use to exercise discretion in their trading decisions (or simply to act on “gut feel“).
Algorithmic trading is also referred to as systematic trading or rules-based trading, but systematic and rules-based trading doesn’t necessarily need to be fully automated. A discretionary trader, for instance, can apply systems and rules in their trading approach without automation.
So, it’s the combination of well-defined rules and systems, along with automation, that characterizes algorithmic trading.
Given its association with computers and defined rules, which are implemented using coded mathematical equations, algorithmic trading is also referred to as quantitative trading—this may give the impression that algorithmic trading can be complicated, but it doesn’t have to be.
Algorithmic vs discretionary trading
Algorithmic trading, in its purest form, is a mechanical process. The defined rules that underlie the trading system are applied consistently, day in and day out, to drive trading decisions.
A well-designed algorithmic trading system, once it’s in deployment, is intended to operate without the need for human intervention.
Algorithmic trading systems do require ongoing monitoring, however, with occasional updates and improvements. But the idea is to develop a set of rules that can operate across a range of market environments (even if the system isn’t always actively trading) without relying on decisions from outside of the system for day-to-day trading.
Discretionary trading, on the other hand, is more of a judgment-based process. Rules may be few and far between, or they may be fluid and subject to a range of qualitative rather than quantitative criteria.
Discretionary traders typically use fundamental or technical information to motivate their decisions. Fundamental information includes economic, financial accounting, logistical, or circumstantial data, while technical information is usually confined to price patterns and chart formations.
Algorithmic and discretionary trading also tend to suit different personality types. Traders who enjoy thinking through each trading decision, and who believe that the subtleties and nuances involved in each decision are an important part of the process, may prefer discretionary trading.
Traders who enjoy data and statistics, however, and who wish to avoid the stresses associated with making trading decisions one at a time, may be better suited to algorithmic trading.
The choice between algorithmic or discretionary trading ultimately depends on the personality type of the trader, the way they think about risk, and the expectations that they have for their trading outcomes.
While discretionary trading is very popular (likely far more popular than algorithmic trading) and can lead to great success, there are some distinct advantages of algorithmic trading for those who are inclined towards it. According to successful algorithmic traders like Martyn Tinsley and Rober Carver, these include:
Emotional detachment
Fear, greed, regret, doubt—these human emotions can interfer with successful trading decisions.
There’s abundant evidence that humans suffer from cognitive biases, such as a confirmation bias (interpreting information in a manner that confirms already held beliefs) or a loss aversion (a disproportionate desire to avoid a loss rather than make a gain), and these can lead to poor judgment in trading.
Carver, for instance, once missed a once-in-a-lifetime profit opportunity due to an emotionally-driven decision. During the market disruptions of 2009, he hesitated in making a trade that he had thoroughly researched and prepared for.
Despite having years of experience as a professional hedge fund manager, Carver’s emotions got the better of him when it mattered. No one is immune from the strong influence of human cognitive biases.
Algorithmic trading removes emotions from trading decisions. Once a system is developed and deployed, it will run according to its rules and will be devoid of any emotion.
In this way, algorithmic trading systems produce results that reflect the quality of the system, rather than the wavering emotions that may arise with each decision under human hands.
Consistency
Algorithmic trading systems always operate according to their rules. They are transparent (to the designer) in the way that they work, and each decision made can be understood in terms of the rules.
With discretionary trading, it may be hard to understand the nuances behind each decision as there may be many influencing factors at play.
Algorithmic trading, in contrast, always operates transparently and consistently, and this can be a big advantage in interpreting results and improving future trading decisions.
Always on
Discretionary trading requires dedicated time in front of trading screens. In a purely discretionary approach, trades can only be placed after spending time analyzing markets or watching price action on an hour-by-hour basis.
There are only so many hours in each day during which a discretionary trader can apply their craft.
Algorithmic trading, on the other hand, can run continuously. It is always on. This doesn’t mean that trades will occur in any market conditions—the rules can take care of when trades should and shouldn’t occur—but the system never gets tired, loses concentration, takes breaks, or needs to sleep as a human does.
Scale
There are limits to the scope of trading that a discretionary trader can do. How many markets or instruments can they trade at a time? Perhaps a few at most.
The focus and attention required for each trading decision limit the number of trading decisions that can be made. That’s why many successful discretionary traders tend to specialize in certain markets or trading styles.
Algorithmic trading, however, can be applied across dozens, or even hundreds, of instruments simultaneously. It can also operate different trading styles at the same time.
Why does this matter?
Algorithmic trading allows plenty of scope for scaling across instruments and styles. This in turn allows a high degree of diversification.
In a well-designed algorithmic trading system, this diversification can produce more consistent outcomes over time and across a variety of market conditions. All the while running autonomously.
How does algorithmic trading work?
Consider the following set of trading rules:
- Calculate a 10-day simple moving average (MA10)
- Calculate a 100-day simple moving average (MA100)
- When MA10 moves higher than MA100, open a long position (close a short position)
- When MA10 moves lower than MA100, open a short position (close a long position)
This simple set of trading rules can form the basis of an algorithmic trading system—it can be as simple as that!
This type of strategy stays fully invested (either long or short) and is an example of a trend-following strategy. When MA10, a short-term signal, is higher than MA100, a long-term signal, then the strategy is in an uptrend. When MA10 is lower than MA100 the strategy is in a downtrend.
Other common types of algorithmic strategies include mean-reverting and breakout strategies. Mean-reverting strategies try to profit from the tendency of markets to over- or under-shoot their fair value levels (which can be calculated in a variety of ways), while breakout strategies try to profit from strong movements out of established trading zones.
In practice, the above trend following strategy would require some modifications to make it worthwhile and there may be long periods of time when it’s not profitable.
Also, the ease with which long and short positions can be opened and closed will vary with the type of market (eg. in equity markets, it’s harder to open short positions than in futures markets).
But it still doesn’t need to be too complicated.
Institutional vs retail (individual investor) algorithmic trading
There are, however, many algorithmic strategies that are more complicated—sophisticated trading strategies—but these tend to be run by institutional investors.
Institutional investors are professional investors who manage money on behalf of others. They include pension funds, hedge funds, mutual funds, and family offices.
In contrast, retail investors—or individual investors—are typically DIY investors who manage their own money. In some cases, individual investors can also manage money for others and earn a share of the profits.
Who can be an individual algorithmic trader?
A key distinction between institutional and individual investors is scale—institutional investors tend to be large, well-funded organizations with lots of resources, whereas individual investors, as the term suggests, are individuals who invest on a relatively small scale and with limited resources.
But even on a small scale, individual investors can be successful. This is because the essential elements required for algorithmic trading are more accessible and cost-effective than ever before.
In other words, today anyone can be an individual algorithmic trader.
And as the costs of trading and the resources required for it continue to reduce, more and more people are becoming individual investors. And many of those are running their own algorithmic trading strategies.
Types of algorithmic strategies
The sophisticated strategies run by institutional investors don’t necessarily produce better results than simpler strategies. But they can cater to a variety of different risk preferences and can profit from a range of market phenomena beyond the basic trend, mean-reverting, and breakout types of strategies.
| Strategy Type | Source of Profits (Based on Price Action) |
| Trend-following | Profit from participating in identified trends (long or short) |
| Mean-reverting | Profit from the tendency of markets to over- or under-shoot their fair value levels |
| Breakout | Profit from strong movements out of established trading zones |
Examples of the more sophisticated algorithmic trading strategies used by institutional investors include:
- Carry strategies, that buy higher yielding assets and sell lower yielding assets, earning a return on the difference
- Value strategies, that buy cheap assets and sell expensive assets based on mispricing relative to some valuation criteria, earning profits on the difference
- Volatility strategies, that buy implied volatility (based on the pricing in options markets) and sell realised volatility, earning a return on the difference
- Skewness strategies, that profit from mean-reverting price behavior depending on the level of skewness in the return distribution
Another type of algorithmic trading that’s received a lot of attention in recent years is high frequency trading (HFT). This is the type of trading featured in Michael Lewis’s popular book Flash Boys.
HFT is automated trading at a whole different level. It uses powerful computer models and highly optimized infrastructure to trade large volumes in tiny fractions of a second. As the name suggests, the large volumes and small holding periods of HFT result in a very high frequency of trading.
HFT is an approach that only the most sophisticated and well-resourced institutional investors can use. And while it can be beneficial for markets in providing liquidity, it has also been criticized for making profits at the expense of smaller traders by “front running” their orders.
The types of sophisticated trading strategies described above are beyond the scope of most individual investors. Small investors typically do not have the resources (eg. data feeds, computer systems, and analytical software) nor the type of knowledge that’s required for running such strategies.
As already mentioned, however, you don’t need a sophisticated trading strategy in order to be a profitable algorithmic trader—this is good news for individual investors.
But profitable trading of any sort—algorithmic or otherwise—isn’t easy. It takes knowledge, practice, and patience.
It also helps to have realistic expectations about the types of profits—and losses—that you can expect to earn.
Is algorithmic trading profitable?
So, how much can you actually earn through algorithmic trading?
This isn’t straightforward to answer since actual trading profits vary greatly with different approaches, market conditions, and parameter choices. It’s not easy to collate this kind of information.
Realistic discretionary trading profits
It’s also worth remembering that algorithmic trading is different from discretionary trading—which is a more familiar form of trading for many people—and you’re likely to earn different profits from each approach.
And even with discretionary trading, there’s wide disagreement about how much you can actually make.
Consider discretionary forex trading, for example. There are many misconceptions about how much individual traders can make, with some people thinking it’s easy to make consistently large profits with low risk.
But the reality is different.
Experienced trading veterans suggest that if a trader can make around 2-5% profits per month, consistently over time, then they’re considered to be a very good trader. It’s hard to do much better than that.
Institutional and individual algorithmic trading profits
To get a sense of how profitable algorithmic trading can be, let’s look at a few examples.
Firstly, let’s consider institutional algorithmic trading.
There’s a long history of systematic institutional trading strategies that have been profitable over decades. Not all of these have been fully automated, however, as many have been around since before the days of powerful, cheap computing. But they’ve been built on systematic, rules-based techniques that form the basis of algorithmic trading approaches.
The turtle traders
Perhaps the most famous example of such approaches is the turtle trading system.
The turtle trading system evolved out of an interesting experiment conducted in the early 1980s. Two world-renown commodity traders—Richard Dennis and William Eckhardt—were debating whether anyone could be taught to trade.
They decided to run an experiment to find out.
While Dennis believed that anyone could be taught to trade, Eckhardt was skeptical. Dennis planned to test his idea by seeking out a group of people from different backgrounds—none of them with trading experience—and teaching them to trade.
Sound familiar? For those of you who know popular eighties culture, the movie Trading Places was loosely based on the turtle trading experiment.
Dennis placed an ad in the Wall Street Journal and had thousands of applicants reply. From those, he chose 14. He trained them in just 2 weeks using a simple trading process—a systematic approach—that could be repeated over and over again.
He called his traders turtles, as he felt they could easily be grown into successful traders, just like growing turtles on a farm he’d once visited in Singapore.
Hence, the turtle trading system was born.
The system itself is a simple trend-following strategy based entirely on price action (ie. ignoring economic or other financial information).
While the exact parameters are proprietary, the system sought to buy into strong uptrends and sell into strong downtrends. The instruments traded were futures, so it was easy to take both long (buy) and short (sell) positions.
Along with sensible rules to manage risk, a healthy degree of diversification, and clear entry and exit rules, the turtle trading system was an early example of an algorithmic trading approach (even though it wasn’t automated).
And was it profitable?
Yes! The turtle trading system worked wonderfully well and the turtle traders were very successful. According to a former turtle, Russell Sands, the early batches of turtle traders earned over $175 million in only five years.
And while it’s not entirely clear how successful the turtle system would be today—markets have evolved and have become more competitive—many experts contend that the basic set of turtle trading rules can still be profitable with some fine-tuning.
Sands estimates, for instance, that if the turtle trading system was applied in 2007 to a balance of $10,000, it would have grown to $25,000 by the end of the year.
Following the trend
Let’s revisit the simple set of trading rules that we discussed earlier.
Recall that those rules describe a basic trend-following strategy that uses MA10 and MA100, stays fully invested, and takes both long and short positions (assuming it’s easy to do so, for instance, if trading futures markets).
How profitable can this simple, algorithmic trend-following strategy be?
To find out, let’s consider some analysis by Andreas Clenow, a veteran algorithmic trader and hedge fund manager.
In his book, Following The Trend, Clenow outlines a simple strategy that’s very similar to our strategy. It invests in a diversified basket of futures instruments across a variety of markets— including equities, commodities, and currencies—and uses daily data, only trading the day after a signal.
A signal is when the MA10 crosses the MA100 (ie. moves higher or lower). Trading the day after helps to replicate real-world conditions (ie. avoiding data snooping biases) when testing the strategy using historical data.
Clenow also adopts position sizing rules to limit the risk of loss on the strategy.
So, how does the strategy perform?
Clenow tested the strategy over the historical period from January 1990 to December 2011, a period that saw both bull and bear markets of considerable strength.
To put the strategy’s performance in perspective, Clenow compares it against a global equities index (MSCI World total return), and an index that replicates the overall managed-futures industry (Barclay BTOP 50). The results are shown below.
| Performance metric | Simple-trend following | MSCI World total return | Barclay BTOP 50 |
| Compound annual return | 28.9% | 4.7% | 7.3% |
| World drawdown | -48% | -57.5% | -13.3% |
| Sharpe ratio (risk-free 2.5%) | 0.89 | 0.22 | 0.54 |
What do we notice?
- Firstly, the strategy performed spectacularly well over the 20 years to 2011! Its average return (28.9%) was far higher than both global equities (4.7%) or managed-futures (7.3%).
- The strategy exprienced significant drawdowns (periods of cumulative loss), with its worst drawdown (-48%) being less than that of global equities (-57.5%) but more than that of managed-futures (-13.3%)
- Its risk-adjusted return (0.89), as measured by the Sharpe ratio (excess returns over the risk-free rate relative to the standard deviation of returns), was higher than both global equities (0.22) and managed-futures (0.54).
Clenow’s analysis shows that even a simple algorithmic strategy can perform very well.
The above trend-following strategy outperformed (on several metrics) both global equities and the average (sophisticated) managed-futures strategy over the 20 years to 2011.
But simple algorithmic strategies may be subject to long periods of poor performance or occasional large drawdowns. Risk management using proper diversification and position-sizing is important.
And so is patience, to endure the bad times as well as the good.
It’s also important to recognize that financial markets can go through significantly different periods over time—just because a strategy has performed well in the past, it doesn’t mean it will do so in future.
Empowering individual algorithmic traders
Let’s now turn to individual algorithmic trading—how can we get a sense of how these strategies perform?
Fortunately, a recent platform has emerged that allows individual (or small scale) algorithmic traders to build a public track record. These traders can then trade other peoples’ money (investors), if their track record attracts capital, and share in the profits.
The platform is called Darwinex and it effectively allows individual traders to become “mini hedge fund managers“.
What’s more, Darwinex replicates each trader’s strategy (using standardized risk settings) without revealing the transactions underlying the strategy. Hence, each trader’s intellectual property is protected.
Why do we care about Darwinex?
Because the track records available on Darwinex show us what’s possible in terms of individual algorithmic trading performance.
Each individual trading strategy available on Darwinex is called a Darwin. Let’s look at a few.
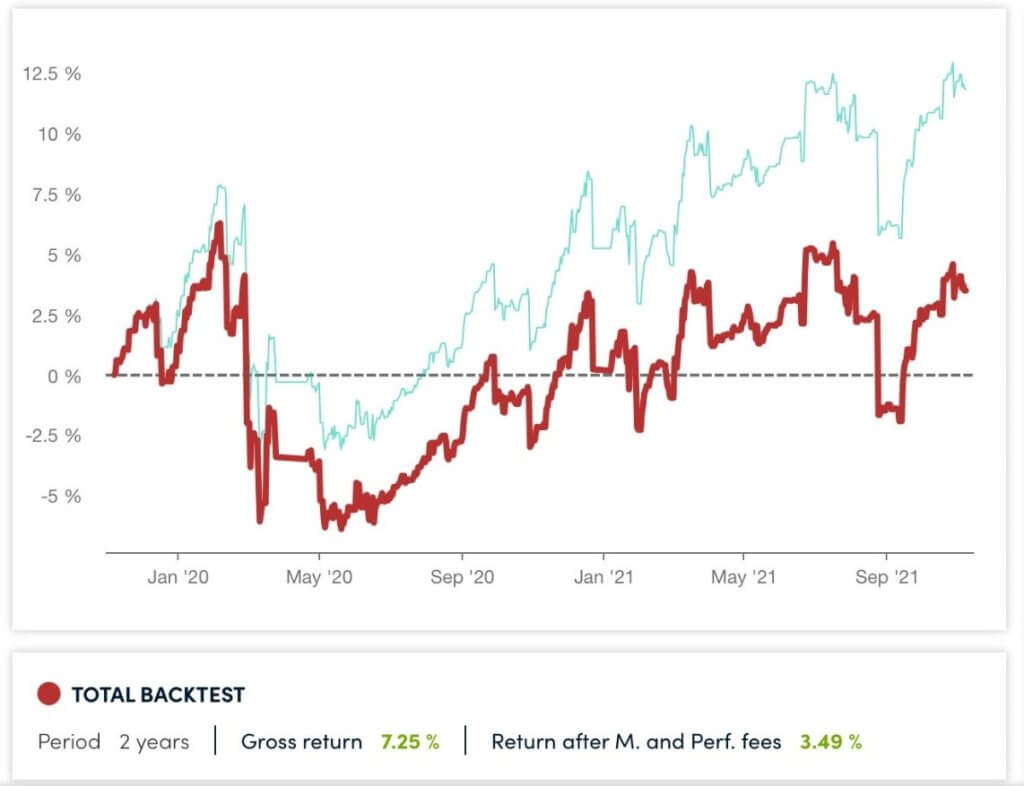
The Darwin CBY has been trading since May 2017 and has returned over 16% pa from inception to November 2021, with a maximum drawdown of -10%—a solid performance. It is offered on Darwinex by a trader called XedFX and invests in a range of currencies (AUD, EUR, GBP, USD, JPY, and CAD) amongst other assets.
Over the 2 years to November 2021, CBY’s performance has been less positive, returning around 7% pa (before fees and profit share) as shown in the chart below.
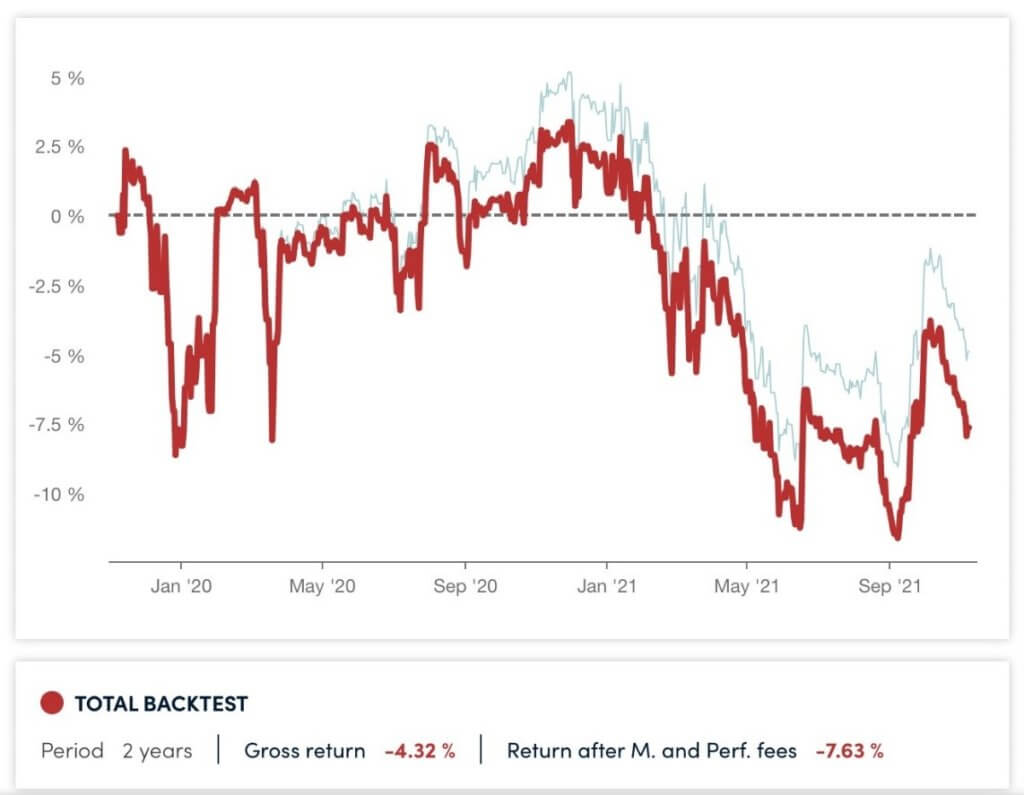
Another Darwin, ULI offered by a trader called bocoja, has returned less than CBY (just over 4% pa) but with a longer track record (since June 2016). ULI also invests in currencies (GBP, USD, EUR, and NZD) and a range of other assets including gold.
Over the 2 years to November 2021 ULI’s performance has been negative, returning less than -4% pa, as shown in the chart below.
The above 2 Darwins give us a sense of what individual algorithmic trading strategies can achieve, with sometimes positive and sometimes negative performance.
There are many more Darwins available, of course, and their track records provide a good indication of the range of performance possibilities.
The below chart shows a selection of 10 Darwins combined into a portfolio with a weight of 10% each. The performance of this portfolio over the 2 years to November 2021 was nearly 16% pa, as shown.
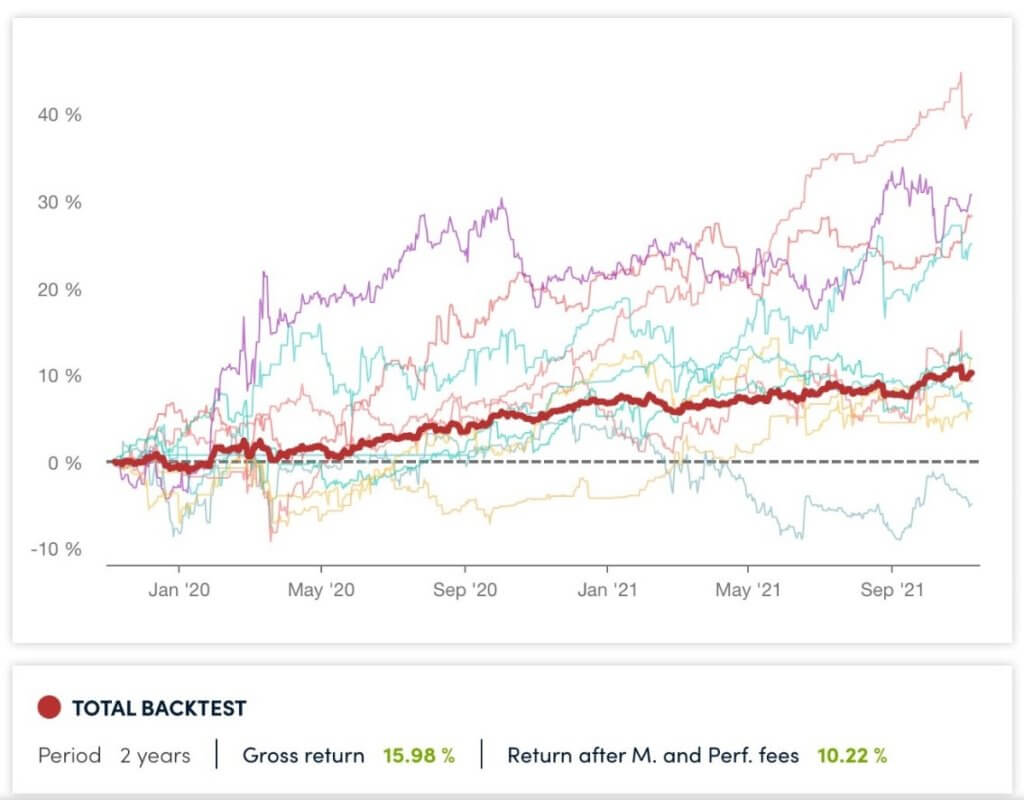
From the Darwins on Darwinex, we can see that it’s possible to trade algorithmic strategies on a small scale (as individual traders) and generate viable track records that can be verified and even offered to external investors. In this way, even small traders can earn an income through profit-share arrangements on the capital provided by external investors.
In other words, it’s possible for individual algorithmic traders to trade like professionals and get paid for managing other people’s money.
You can learn more about the various Darwins on offer by visiting the Darwinex website and seeing for yourself the levels of performance that are currently being generated by successful individual algorithmic traders.
A blueprint for successful algorithmic trading
So, how do you go about developing and trading a successful algorithmic system?
Well, it takes a bit of effort. It also takes time, knowledge, and some patience.
In this section, we’ll outline some of the most important aspects to consider when developing an algorithmic trading system.
First, we’ll consider what makes a good system—what we are looking for—then we’ll consider how to get there.
Characteristics of a successful algorithmic trading system
What are we looking for?
With any good algorithmic trading system, there are a few essential features that must be in place for success. These are:
- Positive expectancy
- Fully automatable
- Acceptable drawdown profile
- Suits your personality
Let’s look closer at each of these.
Positive expectancy
Your system needs to be profitable. A simple, yet essential criteria.
And although this may sound obvious, it’s an aspect of system design that’s often overlooked.
Perhaps it’s because the concept of positive expectancy is misunderstood by many traders, or perhaps because it’s not always easy to calculate.
Either way, to better understand positive expectancy we should first consider what exactly we mean by it.
Put simply, the positive expectancy of a system depends on its profit expectancy, which is the average profits you can expect to earn for every dollar that you risk.
If a system’s profit expectancy is positive, we have a positive expectancy, and if its profit expectancy is negative we have a negative expectancy.
The profit expectancy can be calculated as follows:
Profit expectancy = average profit / average dollars risked per trade
The average profit can be calculated as:
Average profit = (probability of a win x average win) – (probability of a loss x average loss)
The average dollars risked per trade depends on your position sizing approach (which we’ll talk more about later). For now, we’ll assume that the average dollars risked per trade is $2.
Let’s look at a couple of examples to help make it clearer.
For our first example, we’ll assume:
- probability of a win (on average) = 0.4
- average win (amount) = $2
- probability of a loss (on average) = 0.6 (=1-0.4)
- average loss (amount) = $1
Note that the probabilities of wins and losses must sum to 1. This is a requirement for the proper calculation of expectancy. In simple terms, this just means that we’re capturing all of the possibilities, which in our case is either a win or a loss for each trade, nothing else.
Our average profit in this example is:
Average profit = (0.4 x $2) – (0.6 x $1) = $0.8 – $0.6 = $0.2 (ie. 20 cents)
Hence, our profit expectancy = $0.2 / $2 = 0.1 (ie. 10%)
So, our first example has a positive expectancy of 10%.
For our second example we’ll assume:
- probability of a win (on average) = 0.7
- average win (amount) = $0.8
- probability of a loss (on average) = 0.3 (=1-0.7)
- average loss (amount) = $1
Here, our average profit is:
Average profit = (0.7 x $0.8) – (0.3 x $1) = $0.56 – $0.30 = $0.26 (ie. 26 cents)
And our profit expectancy = $0.26 / $2 = 0.1 (ie. 13%), so our second example also has a positive expectancy (13%).
In both of these examples we have positive expectancies. But, of course, this won’t always be the case.
In our first example, for instance, if the average win amount was $1.30 (rather than $2), then the profit expectancy would be:
Profit expectancy = average profit / $2 = [(0.4 x $1.30) – (0.6 x $1)] / $2
= [$0.52 – $0.6] / $2 = -$0.08 / $2
= -4%
In this instance, our profit expectancy is negative and we, therefore, have a negative expectancy.
There are two important things to note from these examples:
- The profit expectancy does not depend only on the size of the average win and loss, but also on the probability of achieving a win or a loss
- You can have a positive expectancy even when your average win is smaller than your average loss—this was the case in our second example—and, similarly, you can have a negative expectancy even if your average win is larger than your average loss
You should also include all costs and expenses (ie. subtract them from profits) in the calculation of profit expectancy to get a realistic estimate for a system. These include brokerage costs and commissions, spreads, fees, and any other costs associated with trading the algorithmic system.
Also, different trading approaches tend to have different relationships between average profits (wins or losses) and the probabilities of wins or losses.
Trend following systems, for example, tend to have lower win probabilities but higher average win amounts relative to loss amounts. Whereas mean-reverting systems tend to have higher win probabilities but lower average win amounts relative to losses.
Both systems can lead to positive or negative expectancies—it’s the overall interaction of wins, losses, costs, and probabilities that matters.
In practice, it isn’t easy to know what values you should assume in your profit expectancy calculation. This requires a thorough knowledge of your system, how it’s likely to perform in the future, and how its performance may vary under different market environments.
These are not easy questions to answer.
But although it may be difficult to estimate, the profit expectancy is a fundamental measure of success for an algorithmic system (or any trading system, for that matter), and it’s worth the time and effort to understand (and estimate) this metric as best you can.
Fully automatable
An algorithmic trading strategy, in its purest form, works autonomously. This means that it is fully automatic. It would still need monitoring and the occasional enhancement, but its day-to-day operations are a mechanical process based on its design rules.
An algorithmic trading system, therefore, must be expressible as a fully automatic process.
This may sound trivial, but in reality, it can be quite challenging.
For a system to be automatable, it requires rules that are clear, quantifiable, complete, and robust. This calls for thought and testing during the design process.
And it’s not always easy to do.
Consider how discretionary price action traders operate, for instance. These traders look for patterns in the price charts of the instruments that they’re trading. The patterns that they look for are based on past experience (or the advice of others) and are expected to help identify price movements that can lead to profitable trades.
These patterns can be quite complex, or can be quite loosely defined, with a range of possible variations that the trader would use their discretion to assess.
For example, a pattern may involve resistance and support levels, technical indicators, price candle formations, geometric shapes formed by price action, and sequencing of designated patterns (eg. “open a long position on the third cross of the previous bar’s closing price once a bullish engulfing candle has been observed, and the short-term moving average is higher than the long-term moving average and above a resistance line”).
To automate such trading decisions is difficult. The range of possible formations would need to be expressed in a mathematical form and fit within a logical sequence. It would then need to be translated into computer code.
Even when this can be done successfully, the testing process may reveal that repeated application of the rules doesn’t produce good results. Subtle variations in price formations, for instance, may be important for trading outcomes.
And while an experienced discretionary trader can evaluate these, it’s difficult to capture in code.
This is why algorithmic trading systems are best suited to simpler rules based on mathematical formulations rather than visual patterns. (There are other reasons why simpler rules may be better than more complex rules for algorithmic systems, but that’s a topic for a separate discussion).
Acceptable drawdown profile
Drawdowns are periods of cumulative loss, and large or frequent drawdowns are what most traders wish to avoid.
The size and frequency of drawdowns are often used as a measure of success for a trading strategy. We had considered drawdowns as one of the key metrics when assessing Clenow’s trend-following strategy, for instance.
Why are drawdowns so important?
Other than the obvious reason that smaller or fewer losses are preferable to larger or frequent losses, there are at least two other reasons:
- Large drawdowns are hard to recover from, as you need to earn a disproportinately large percentage return on your capital compared with the percentage return of the drawdown itself. To illustrate, consider if you had a starting capital of $100 that suffers a drawdown of 50%. After this drawdown, your remaining capital is $50. If you want to recover your capital back to $100, you would need to earn $50 back on the remaining $50—ie. you would need to earn 100% return on the remaining capital. Hence, your drawdown of 50% requires a recovery of 100% to restore your capital. This is hard to do.
- Fewer and smaller drawdowns help to keep your equity curve ‘smoother’. Your equity curve is the balance of your trading capital over time. Large or frequent drawdowns will impact your equity curve, making it look ‘lumpy’ and less consistent. Smoother, more consistent equity curves are easier for most traders to accept from a psychological perspective. It’s also more attractive for prospective investors, according to veteran trader Steve Patterson, if you’re seeking to manage other people’s money.
A successful algorithmic trading strategy would ideally generate drawdowns that are not too large and not too frequent.
The size and frequency of drawdowns that are acceptable will vary from trader to trader, and you would need to decide what is acceptable to you. It will vary with the type of strategy, for instance, and the drawdown profiles of comparable strategies produced by other traders.
Suits your personality
This may not seem very relevant for algorithmic trading, which by its nature is emotionally detached, but choosing a trading style that suits your personality is an important consideration for trading success.
Why does personality matter for algorithmic trading?
Consider a simple trend-following system. As we saw in Clenow’s example, the drawdowns can be quite deep with this style of trading.
Even though the system may be profitable over time, a trader using this system would need to be comfortable with deep drawdowns as a part of the trading experience. If not, they may either quit the system too early, or they may interfere with the system even when there is no need—or if it would be harmful to performance—to do so.
Such a trader may be better suited to a mean-reverting system, for instance, or some other trading appraoch that is less likely to produce deep drawdowns.
For discretionary trading, in contrast, the relevance of psychology in the trading process has been receiving some attention. Mandi Pour Rafsendjani, for instance, a successful trader and skilled trading coach, advocates the value of having a positive mindset as a trader.
Rafsendjani’s advice, however, is just as relevant for algorithmic trading as it is for discretionary trading. This is an often under-appreciated aspect of the algorithmic trading process.
When the performance characteristics of an algorithmic system suit the personality of the trader, there’s a far better likelihood that the trader will manage the system in the way that it’s intended, and they would likely also have a more satisfying trading experience.
All of this can impact trading results.
What will get us there?
We’ve just looked at the essential features of a successful algorithmic trading system.
We’ll now consider the techniques and design elements that will help us to get there—these are summarized in the table below.
| What are we looking for? | What will get us there? |
| Positive expectancy | Robust system design – Fundamental premise – Overfitting – Walk-forward / out-of-sample analysis – Sample size – Risk management – Transaction costs |
| Fully automatable | Codifiable |
| Acceptable drawdown profile | Sensible risk management – Diversification – Leverage – Position sizing |
| Suits your personality | Risk-reward profile |
Let’s take a closer look.
<THIS ARTICLE IS UNDER CONSTRUCTION – TO BE CONTINUED>
Giri Rabindranath is a CFA Charterholder and holds a Master’s degree in Finance. He has over 25 years of professional experience in the financial industry. The views expressed in this article are solely for informational purposes and do not represent financial advice in any way whatsoever.
Risk Disclaimer: Trading CFDs, forex, and other financial instruments, especially if leveraged, is risky. It isn’t suitable for everyone and may result in loss, sometimes substantially more than the initial investment. Depending on the type of instrument, you may not own or have rights to the underlying assets. Past performance is no indication of future performance and tax laws are subject to individual circumstances and are also subject to change at any time. The information on this website is general in nature and doesn’t take into account your personal objectives, financial circumstances, or needs.